
Visualisations for the book "Wine & Data"
We collaborated with Vinotracker on the launch of their new book — "Wine & Data". We designed multiple visualisations and an infographic about the wine industry.

We've been working with Vinotracker since the inception of the company. We first trained the founder in data visualisation methods, and then moved into a long-term collaboration consulting on data visualisation and design strategy.
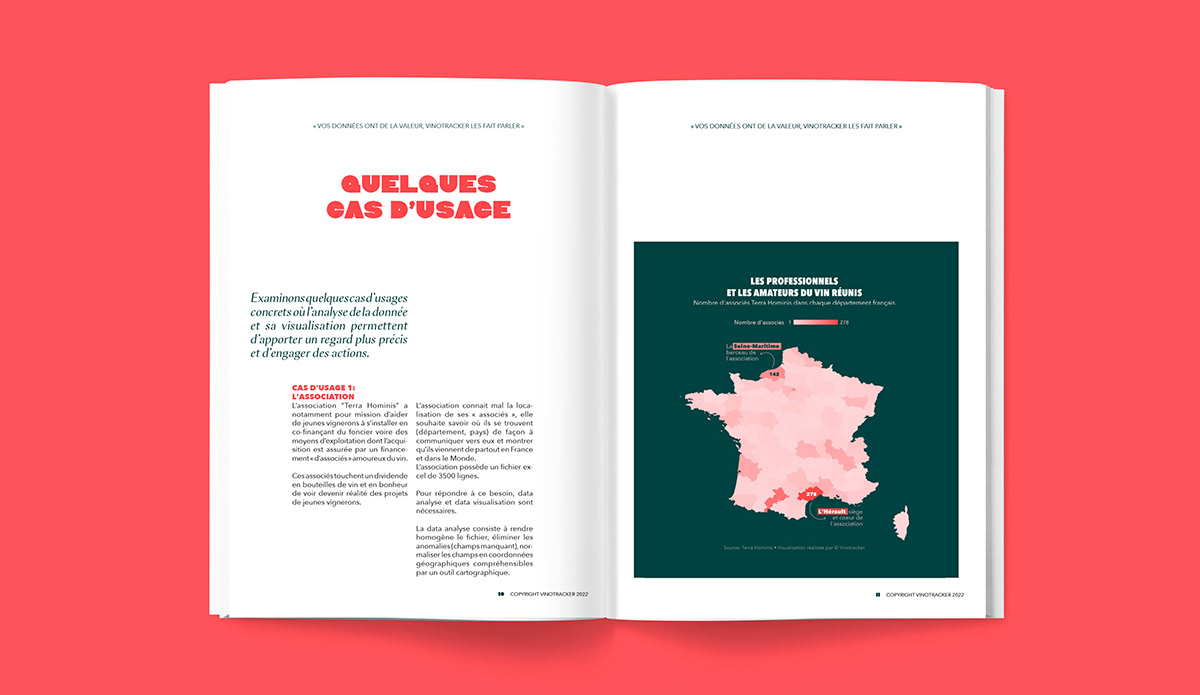
The book project took a few months in the making. As the graphic designer and illustrator set the creative direction for the entire book, we established a data design system that would be clear, modern and recognisable. The infographic and the standalone charts you can see below were the first graphics to be created under these new style guidelines.


Thanks for watching!


